Farhad Omidvar

Info

Projects

world happiness

World Happiness

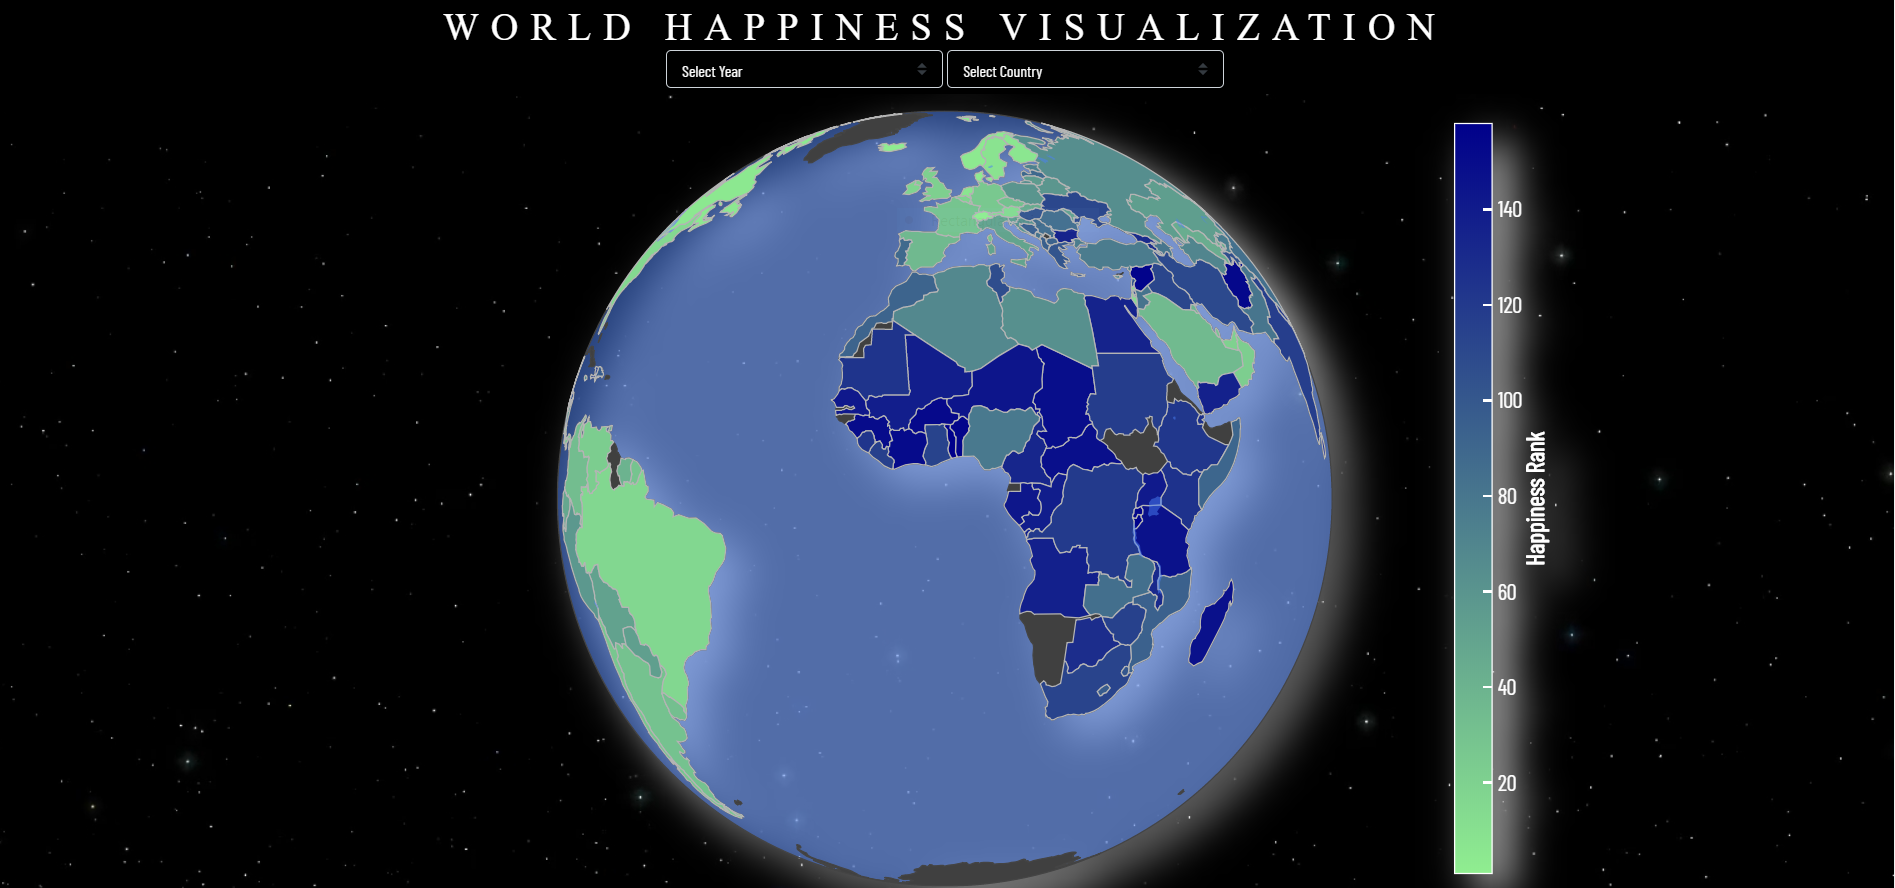
A Python Flask app representing world happiness from 2015-2017 using D3.js - Plotly.js and AnyChart.js to create visualization

Skills:
Python, Flask, SQL, SQLAlchemy, HTML, CSS, Bootstrap, JavaScript, Heroku

GitHub Repository
Health Factors Demo

Health Factors Demographic

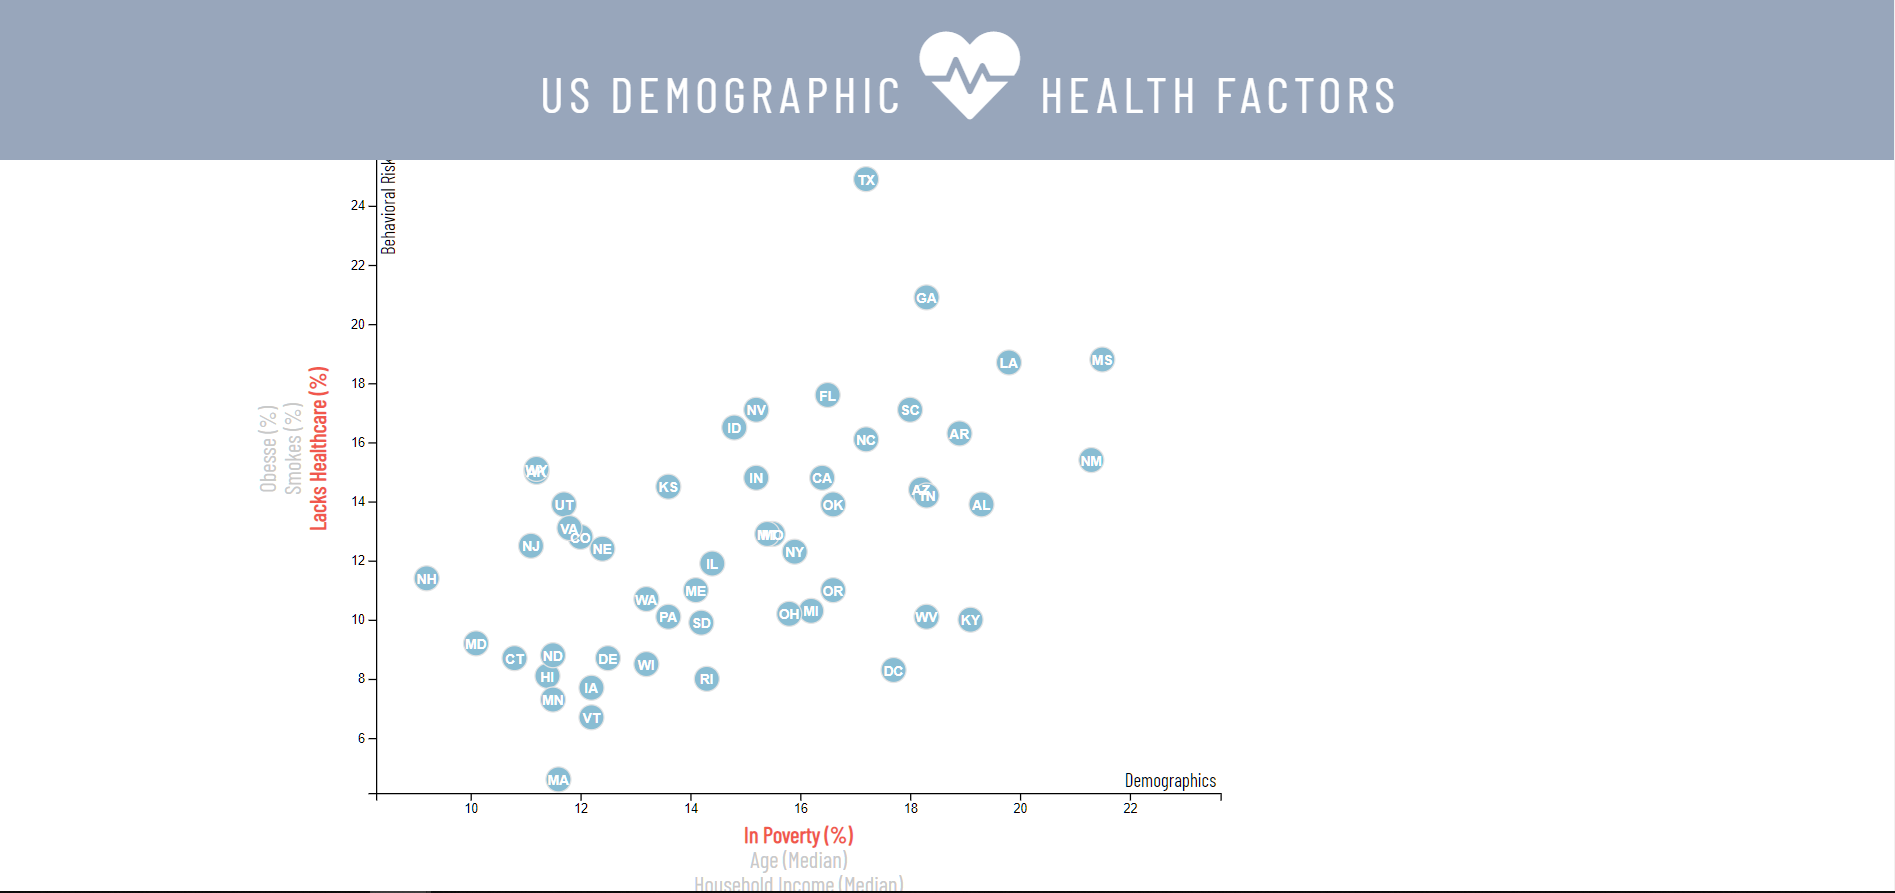
An interactive scatter plot, to explore the correlation between demographics and health risk factors in U.S. using D3.js

Skills:
HTML, CSS, JavaScript, Bootstrap


GitHub Repository
Bacteria Biodiversity

Bacteria Biodiversity Dashboard

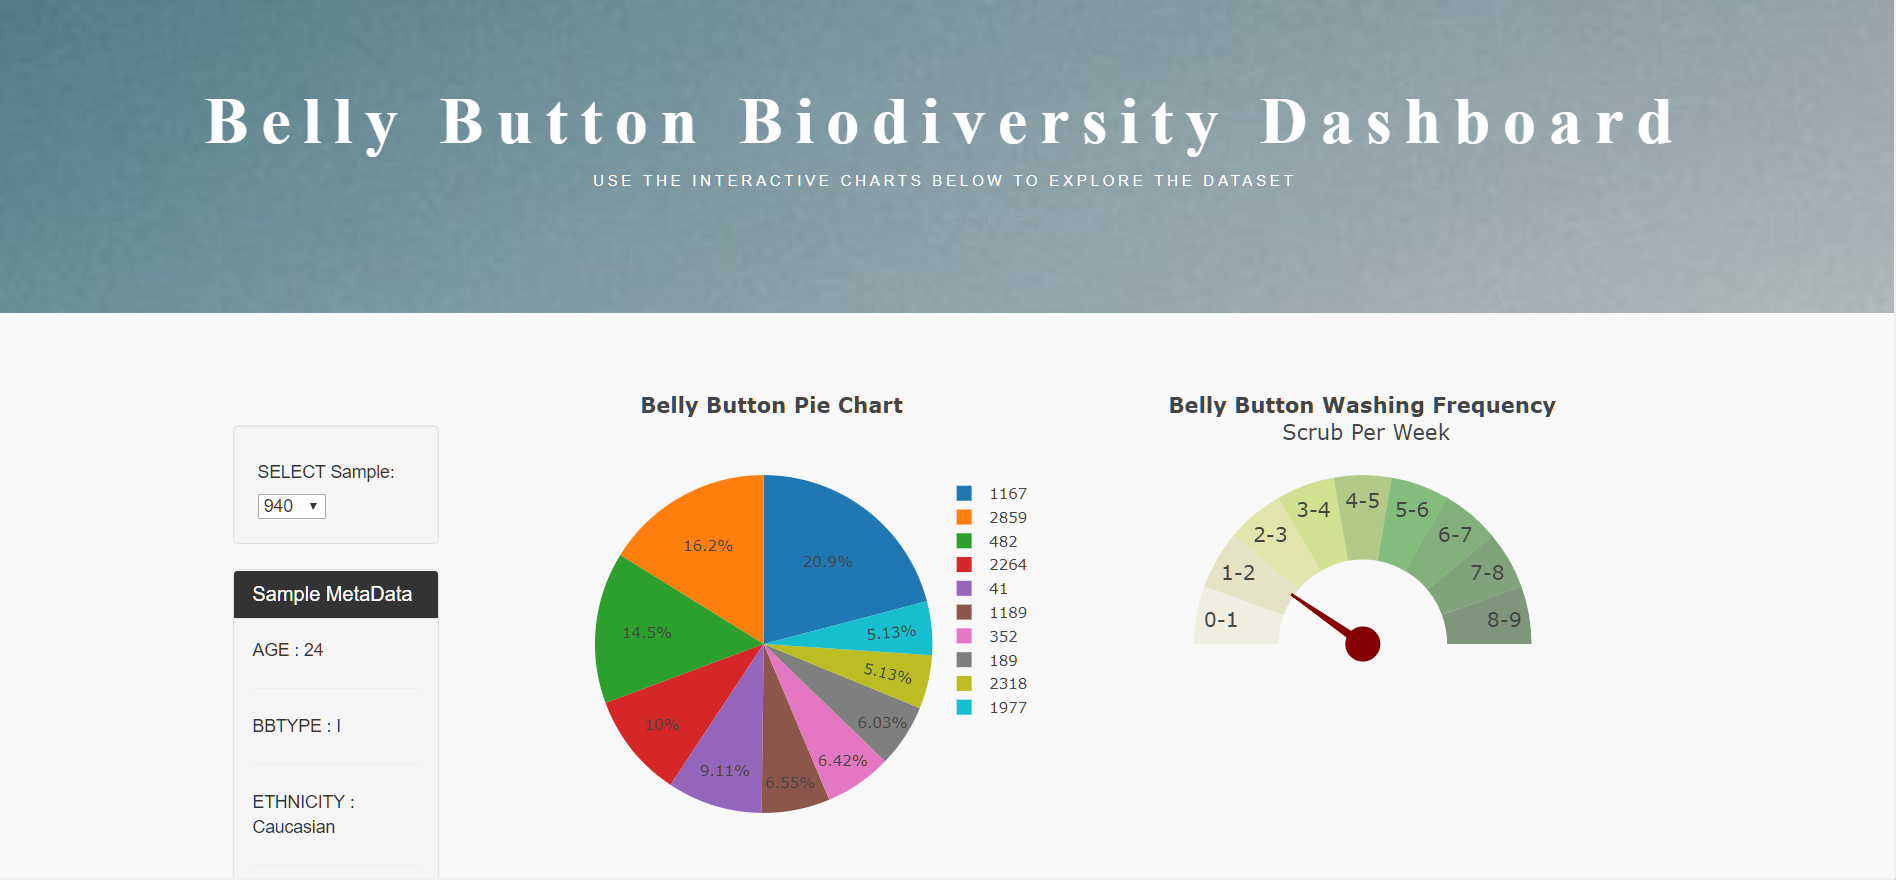
An interactive dashboard to explore the Bacteria Biodiversity dataset, using Plotly.js to create visualizations

Skills:
Python, Pandas, Flask, SQLALchemy, SQL, HTML, CSS, Bootstrap, JavaScript, Heroku

GitHub Repository
mission to mars

Mission to Mars

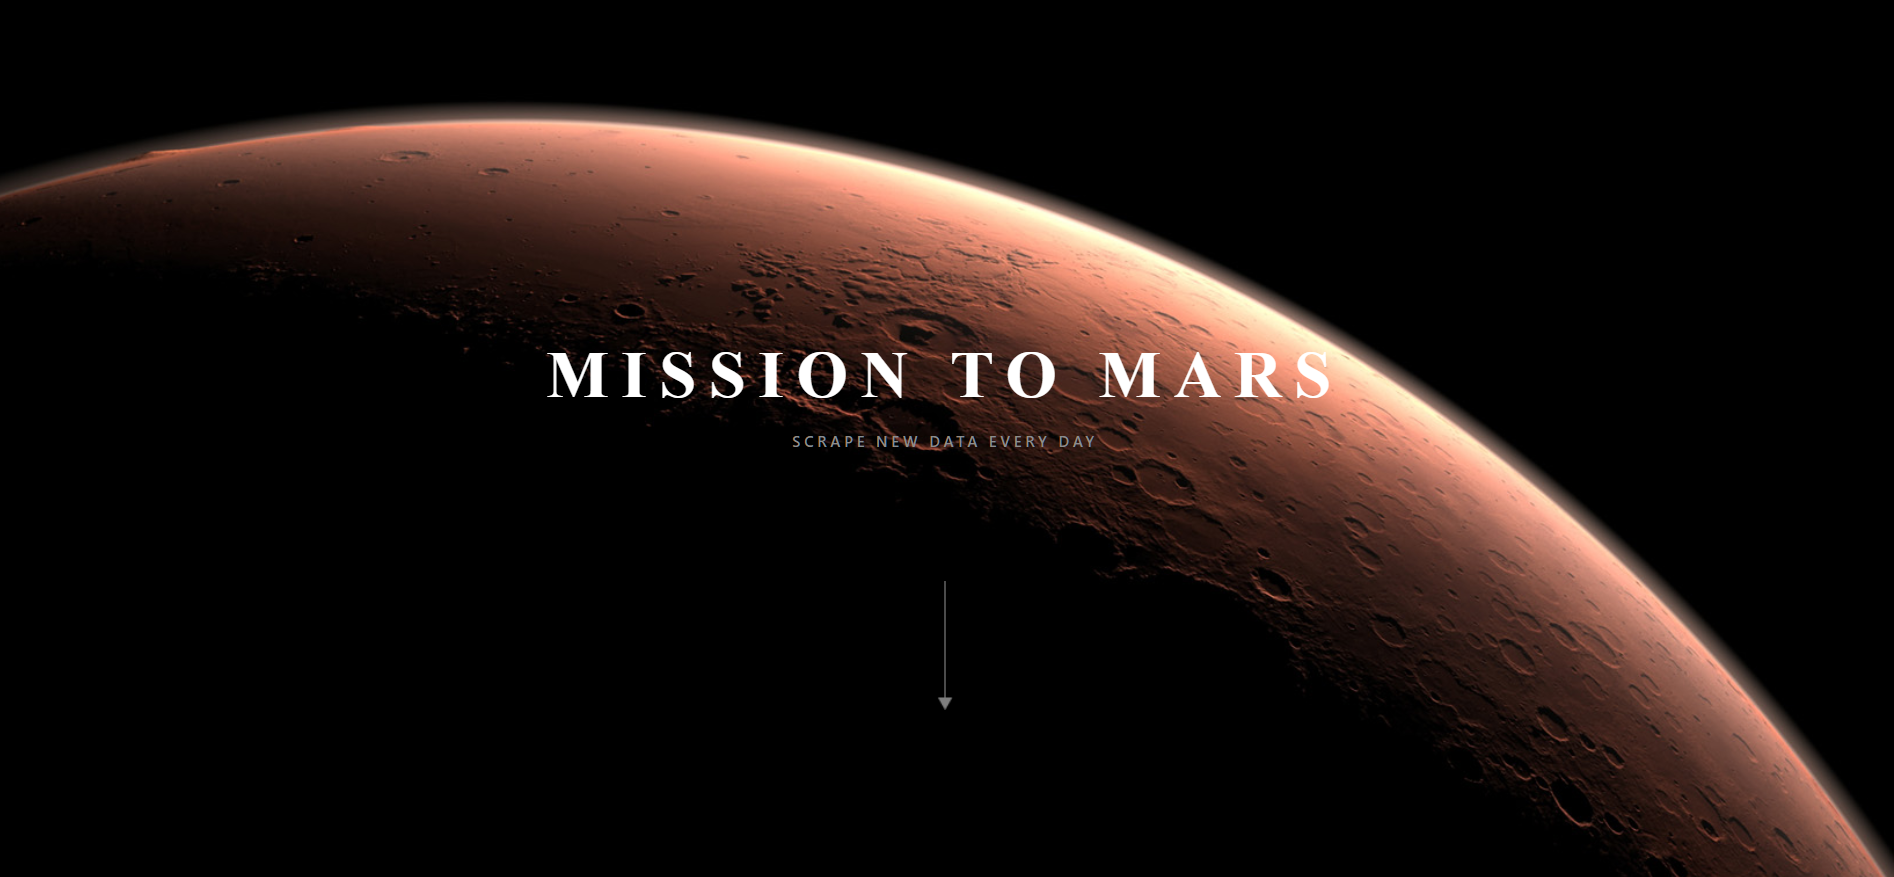
A webpage to display mars information scraped from various sources, using Splinter, BeautifulSoup and MongoDB database

Skills:
Python, Flask, Jupyter Notebook, MongoDB, PyMongo, Pandas, Splinter, BeautifulSoup, HTML, CSS, Bootstrap, Heroku

GitHub Repository
UFO Sightings

UFO Sightings

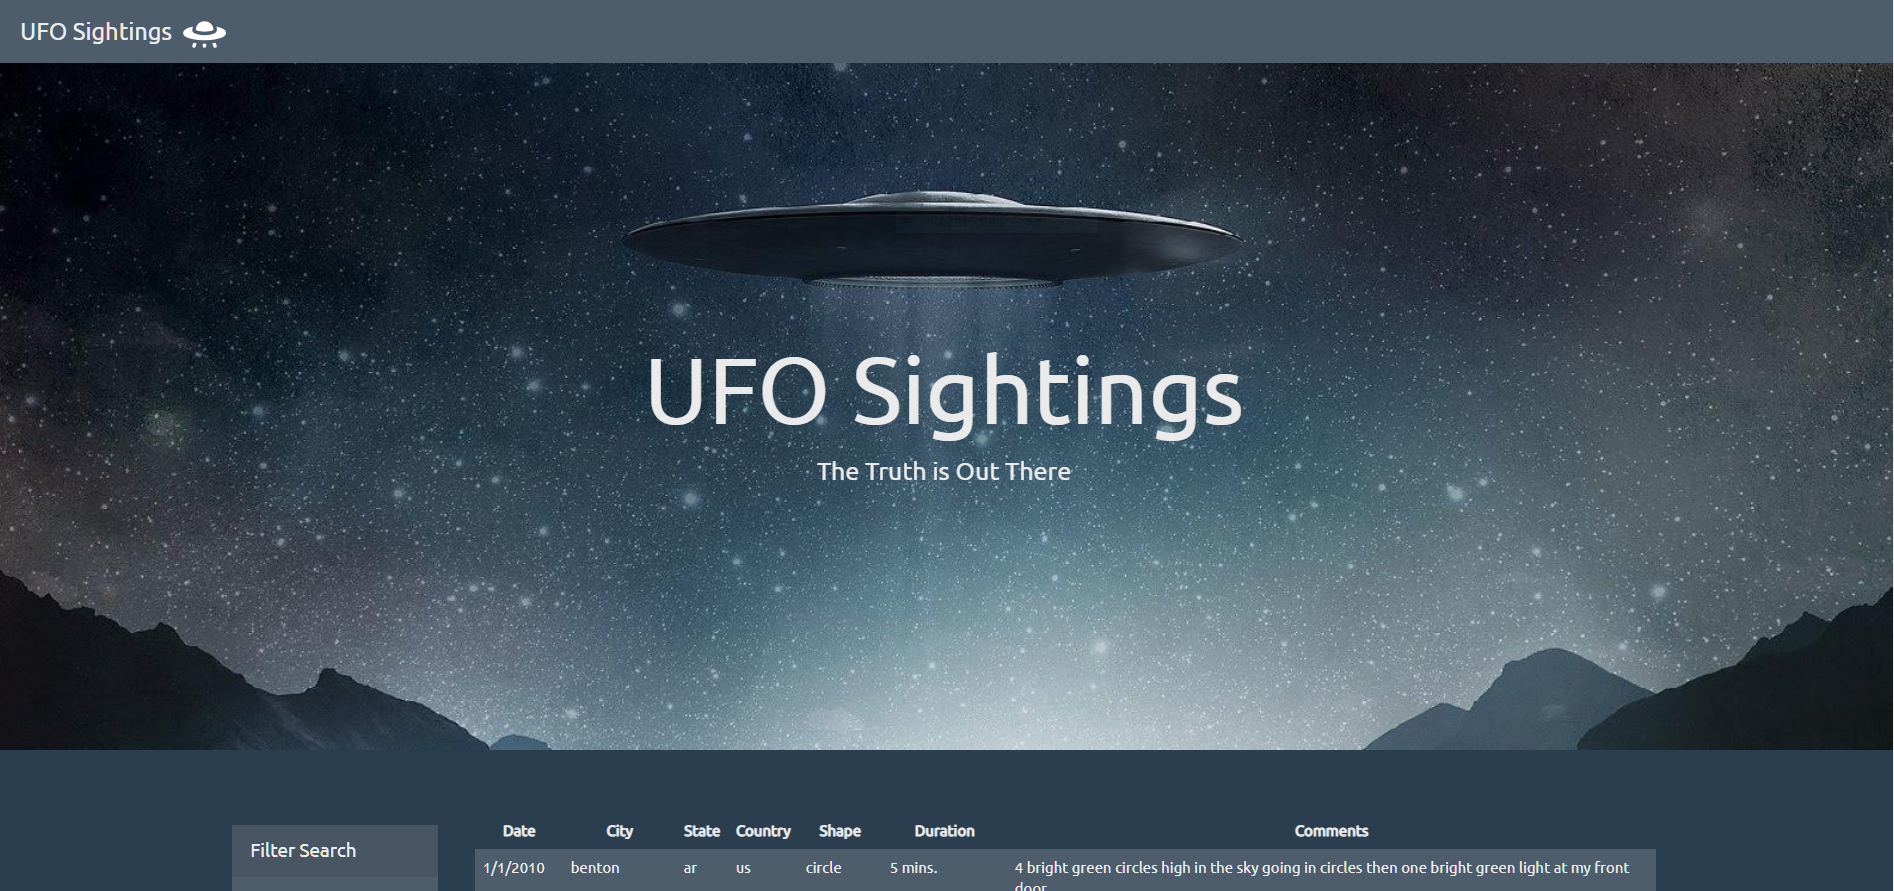
An interactive webpage to display a table of UFO sightings filtering data through an HTML form using JavaScript and D3.js

Skills:
HTML, CSS, JavaScript, Bootstrap


GitHub Repository
Weather Visualization

Weather Analysis

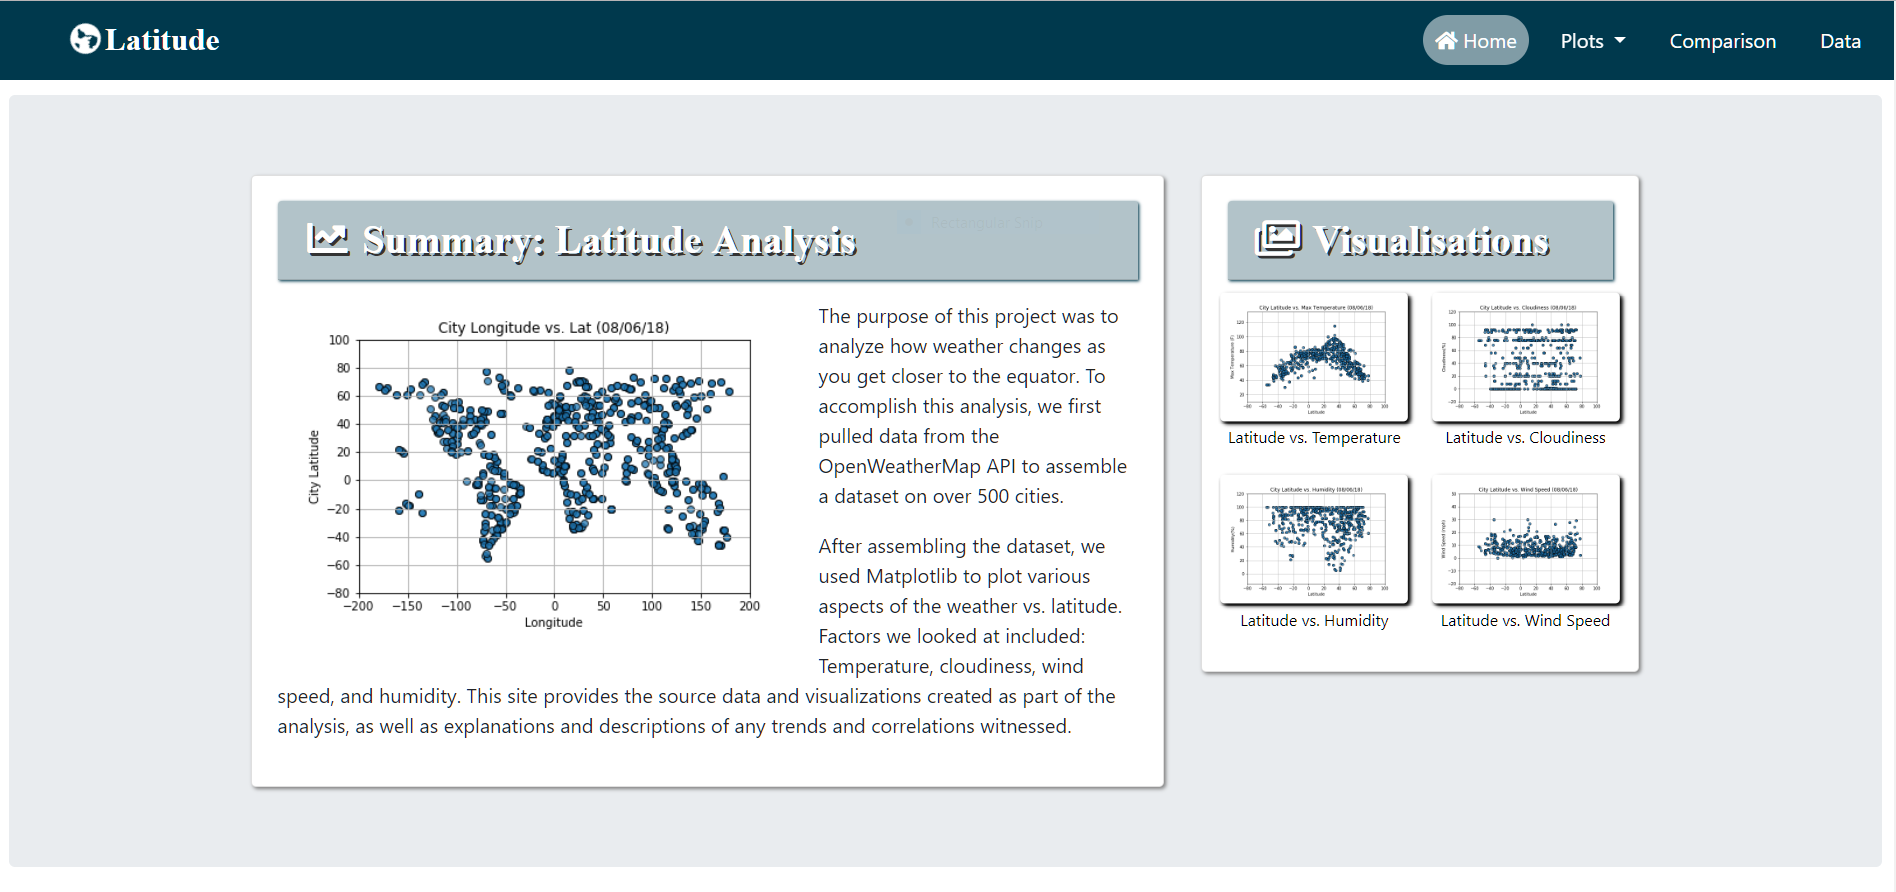
A webpage display analysis of the weather across the world based on proximity to the equator using Matplotlib to create visualization

Skills:
Python, Jupyter Notebook, Pandas, NumPy, OpenWeather API, Matplotlib, HTML, CSS, Bootstrap

GitHub Repository (Analysis) / GitHub Repository (Webpage)
311 Calls San Diego

San Diego 311 calls

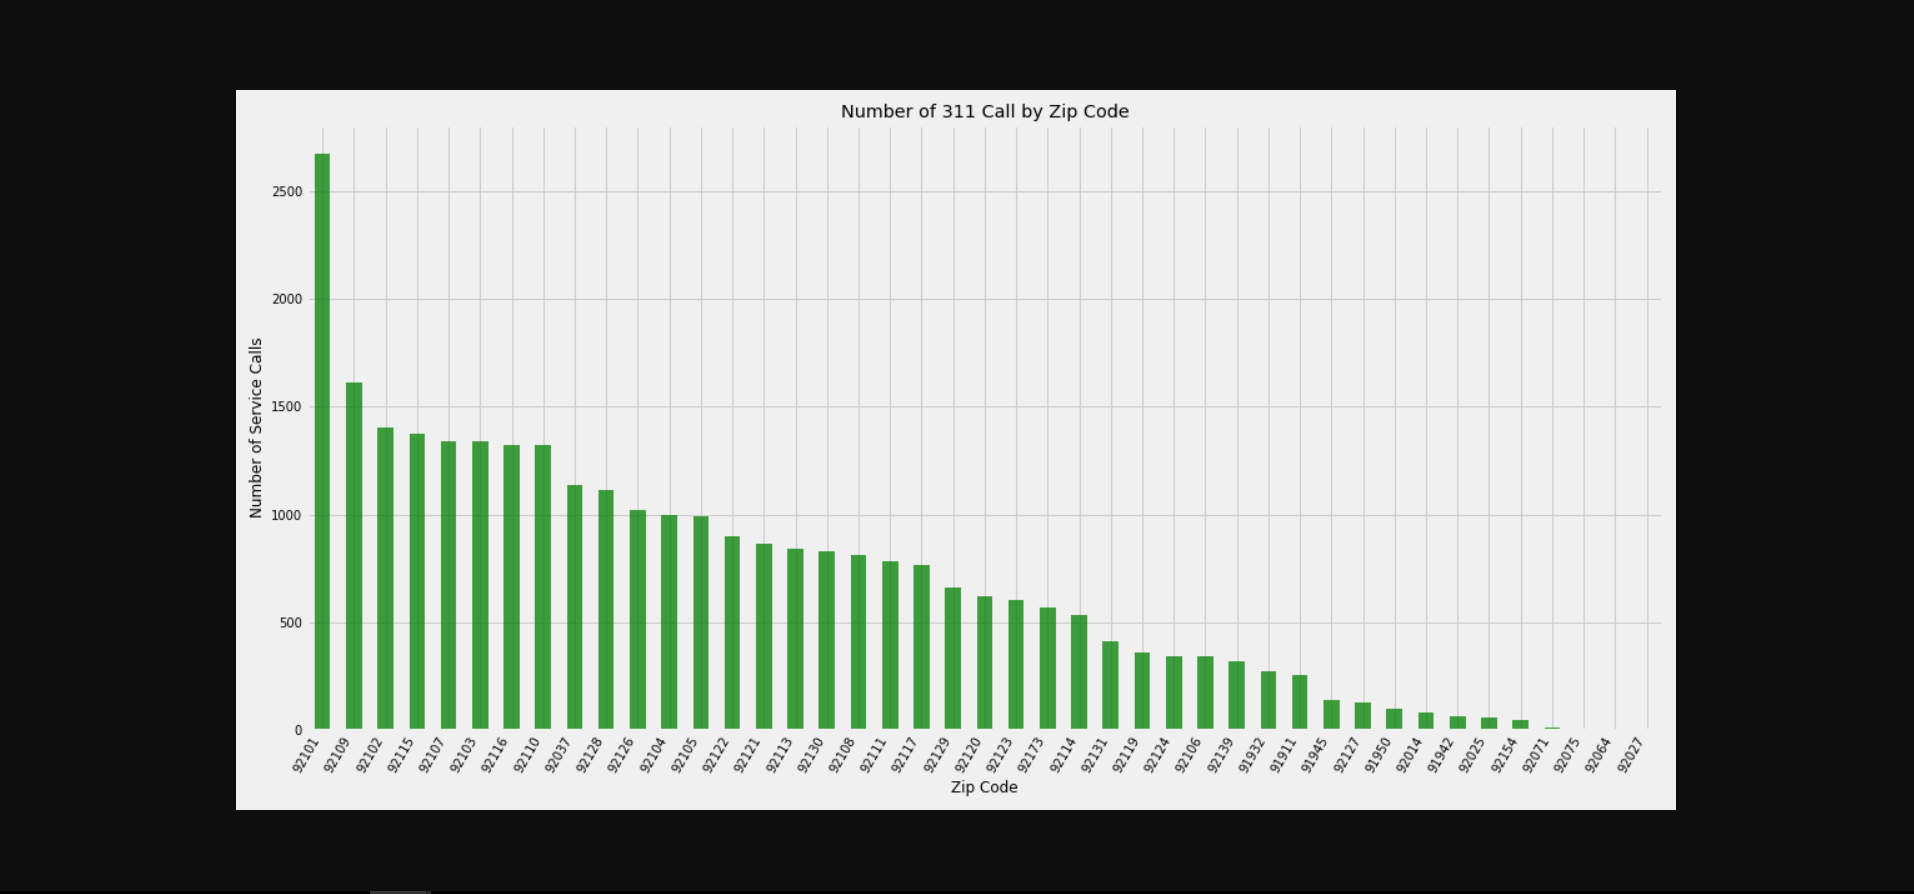
Analysis of San Diego 311 calls using data from City of San Diego, US Census Bureau and Matplotlib, Gmaps to create visualization

Skills:
Python,Jupyter Notebook, Pandas, SciPy, NumPy, Geaocoding API, Gmaps, Regex

GitHub Repository
Earthquake Visualization

Earthquakes Visualization

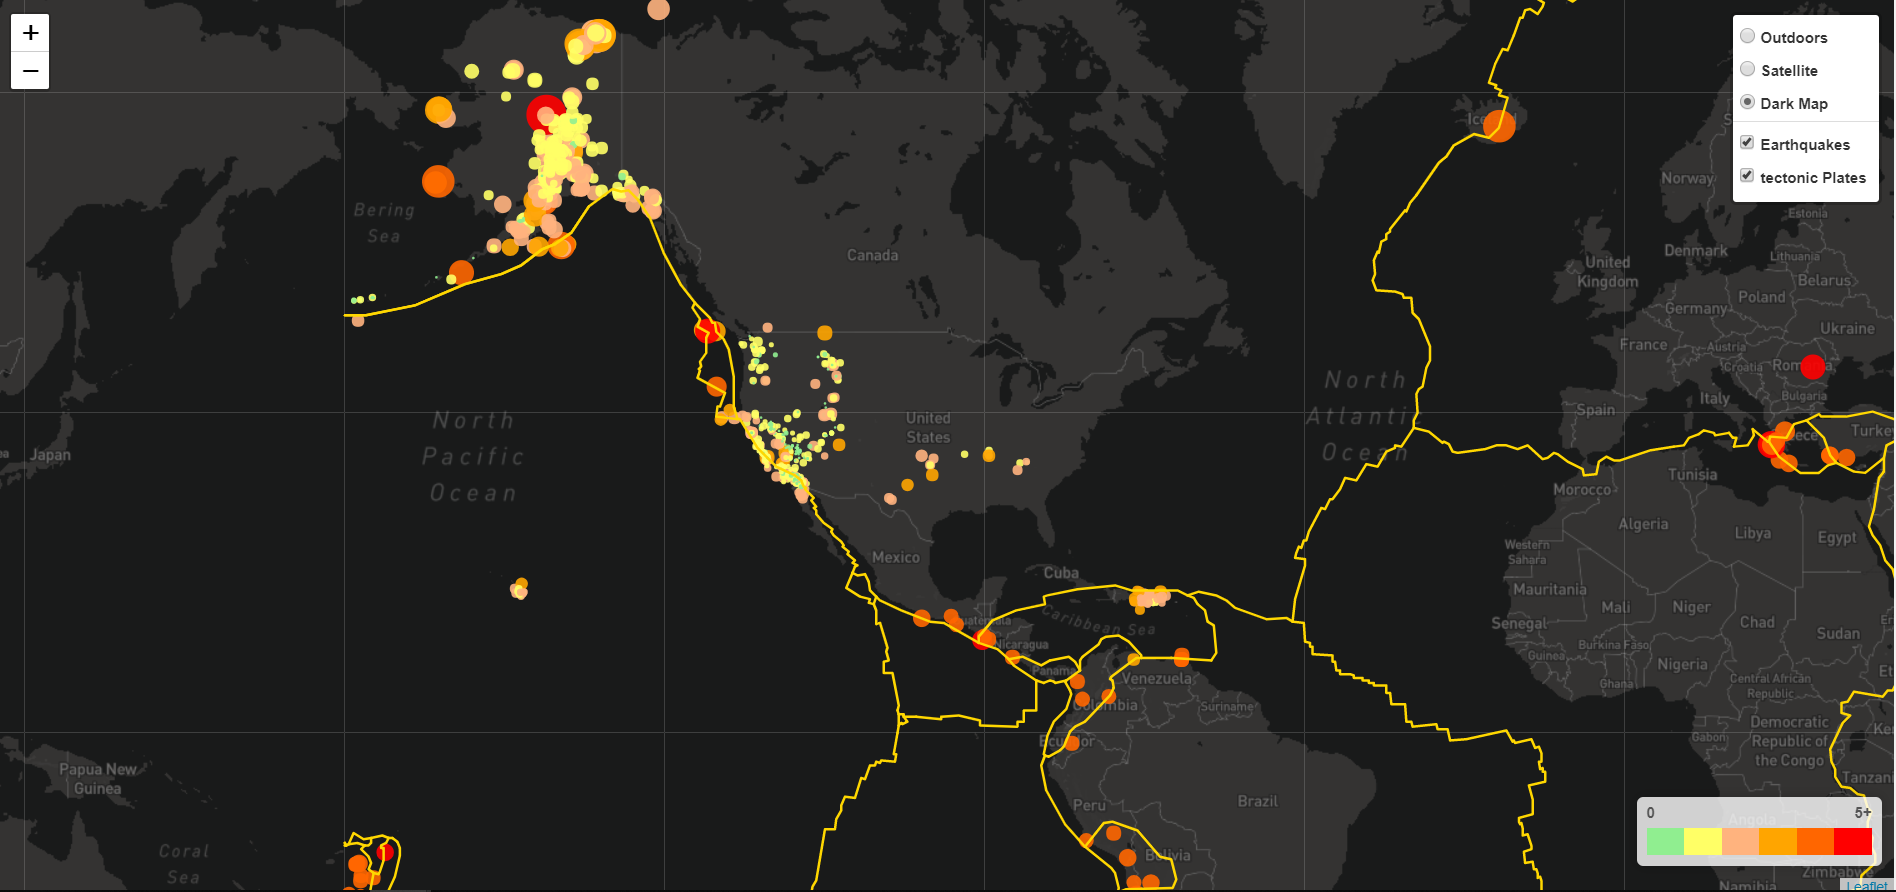
Visualizing the last seven days of US earthquake date using USGS GeoJSON and Leaflet to create the map

Skills:
HTML, CSS, JavaScript, Bootstrap


GitHub Repository